
To monitor a Linux server, we will look at several commands.
1. top
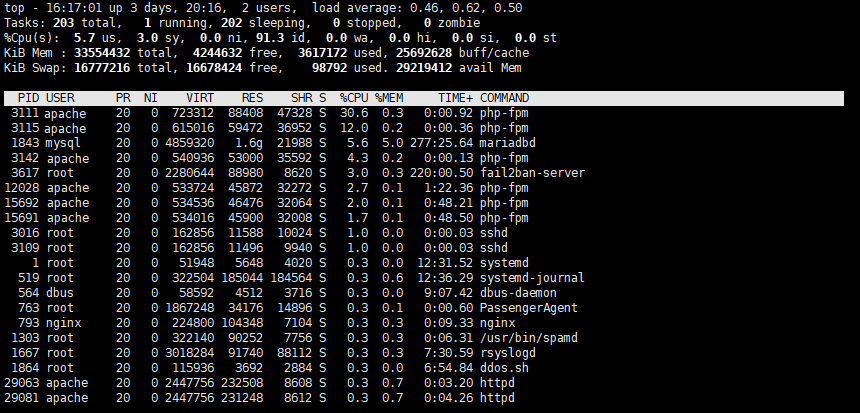
The command allows you to see a list of processes, memory usage, CPU usage and much more:
1.1 To view the processor load for each core, expand the window to full screen and press the number 1.
1.2 In order to understand if there are significant delays on the services side, pay attention to the wa (wait application) parameter. When the server is heavily loaded, this parameter will increase, which means a delay in service; a parameter close to 0 indicates that the server is idle and the load is minimal.
1.3 To display memory usage in megabytes/gigabytes, total and per process, use E and e respectively.
1.4 To display all available options, press h.
2. htop
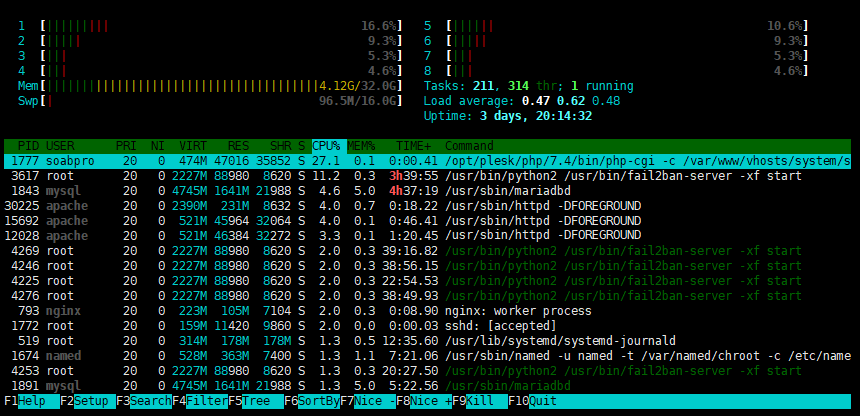
The command displays almost everything that we described for top, just differently and is a good alternative.
3. iftop
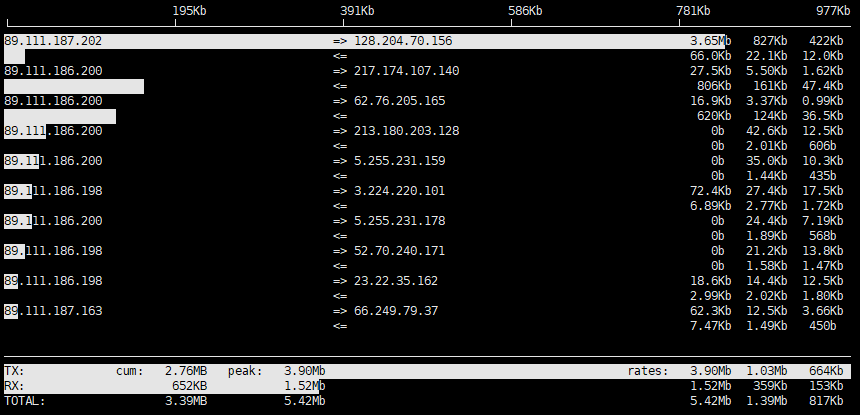
This command has a similar type of information display as top, only in this case we are talking about using the network.
3.1 To turn off and on the display of host names instead of IP addresses, use n. 3.2 You can also set up filtering and sorting, to see all the available options use h.
4. nload

The command gives a graphical display of network load in the console, using ascii characters.
4.1 To view network load on each network interface, use the left and right arrows. 4.2 If necessary, you can set the update period and specify the network interface at startup, use the -h switch for help.