In this guide, we will review the main causes of high load on a virtual server and how to resolve them.
For example, when opening a website hosted on the server, there are significant delays and slow execution of commands in the console.
1. Checking the Load
For example, with 6 CPU cores, the maximum load (Load Average) should equal 6 (1 is 100% of a core).
In our example, we use the command:
top
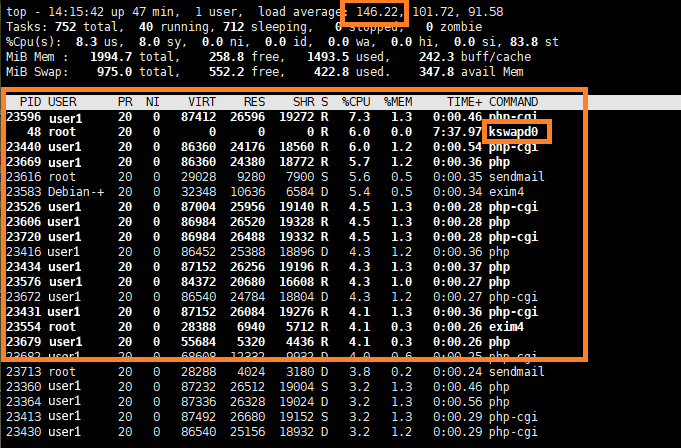
In the screenshot, we can see that the load indicator is significantly exceeded, indicating a very high load on the virtual machine.

Thus, the reason for the server's slow performance is a significant overload. In our example, we also see processes that are causing this load, marked as (R) - (Running - active processes).
In the COMMAND column, we can see the specific command that is consuming the most resources. In our case, these are PHP scripts.
Also, pay attention to the Tasks parameter, which shows the number of processes on the virtual machine - 752, with 40 processes in active status.
For example, under normal operation of a site with 700 unique visitors per day and around 21,000 visitors per month, with a similar server configuration, the load is: LA - 0.41, Tasks - 51 (2 running).
It is quite apparent that the server is likely under a flood or DoS attack, or scripts are being executed to send spam, or the server is being used as an attacker’s proxy.
2. Solution
It is often difficult to work in the console under high load. Since in our case, it’s the web services causing the issue, let's stop them:
service nginx stop
service apache2 stop
In some cases, these commands may take a long time to execute, so it's better to terminate the processes forcefully.
Check the PID of active processes and terminate them using the following command (where pid is the process ID):
kill -9 pid
If the top command is slow to start or lagging, use ps aux with a filter for the process name:
ps aux | grep nginx
After terminating these processes, the load should return to normal. Then, you can check the access log for repeated requests and identify the path to the script using the tail command and the grep filter.
tail -f /var/log/nginx/access.log
Note! You may have a different log file path and name.
Next, delete the malicious scripts. They will also have a different creation date compared to the main files, which can be seen when using the file manager mc.
2.1 Alternative Method to Find the Script Causing High Load
If the server is responding to your commands with a slight delay (tolerable), you can find the script file by using the following command (where pid is the PHP process ID):
lsof -p pid
Delete the malicious files, and the load on the server will decrease.
Malicious files are not always present in the case of DoS or DDoS attacks. In this situation, you will need to implement protection, which we have described in more detail here: Protecting Your Web Server from Flood Attacks
This scenario is more likely if popular CMSs are used on the server and have not been updated for a long time.

